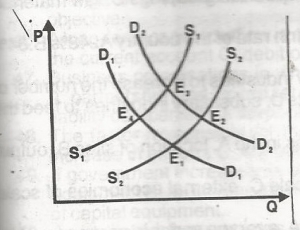
A. E3
B. E1
C. E4
D. E2
Correct Answer:
Option D – E2

A. E3
B. E1
C. E4
D. E2
Correct Answer:
Option D – E2
 Download Business Administration Project Topic PDF - Effects of Job Stress on Employee’s Performance in Evans Nigeria
₦300.00
Download Accountancy Project Topic PDF - Effect Of Cost Control On The Profit Of An Organization (A Case Study Viju Milk Industries Nigeria Limited)
₦400.00
Download Animal Production Journal Article PDF - Performance of Some Forage Rass Species in the Southern Guinea Savannah Agro-Ecological Zone in Nasarawa State of Nigeria
₦300.00
Download Conference Paper Article PDF - Video Summarization Based Handout Generation from Video Lectures: A Gesture Recognition Framework
₦300.00
Download Conference on Advanced Computer Theory Article PDF - Real-Time Mono Vision Gesture-Based Virtual Keyboard System
₦300.00
Download Business Administration Project Topic PDF - Effects of Job Stress on Employee’s Performance in Evans Nigeria
₦300.00
Download Accountancy Project Topic PDF - Effect Of Cost Control On The Profit Of An Organization (A Case Study Viju Milk Industries Nigeria Limited)
₦400.00
Download Animal Production Journal Article PDF - Performance of Some Forage Rass Species in the Southern Guinea Savannah Agro-Ecological Zone in Nasarawa State of Nigeria
₦300.00
Download Conference Paper Article PDF - Video Summarization Based Handout Generation from Video Lectures: A Gesture Recognition Framework
₦300.00
Download Conference on Advanced Computer Theory Article PDF - Real-Time Mono Vision Gesture-Based Virtual Keyboard System
₦300.00
Copyright warnings! Do not copy.


