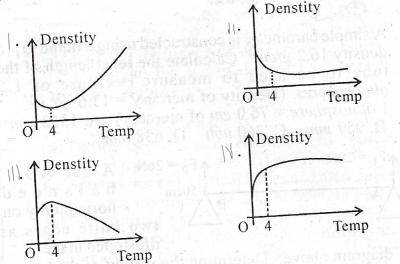
A. I
B. II
C. III
D. IV
Correct Answer: Option D
D. IV
A. I
B. II
C. III
D. IV
Correct Answer: Option D
D. IV
 Land Law and the Consequences of Unauthorized Land Transfers in Nigeria
Original price was: ₦1,000.00.₦300.00Current price is: ₦300.00.
Co-Ownership Structures and Land Acquisition Methods in Nigeria
Original price was: ₦1,000.00.₦300.00Current price is: ₦300.00.
Rights in Community Land and Fundamental Land Concepts in Nigeria
Original price was: ₦1,000.00.₦300.00Current price is: ₦300.00.
Customary Land Control and the Origins of Nigeria's Land Use Act
Original price was: ₦1,000.00.₦300.00Current price is: ₦300.00.
Land Ownership Principles and Transaction Laws in Nigeria
Original price was: ₦1,000.00.₦300.00Current price is: ₦300.00.
Land Law and the Consequences of Unauthorized Land Transfers in Nigeria
Original price was: ₦1,000.00.₦300.00Current price is: ₦300.00.
Co-Ownership Structures and Land Acquisition Methods in Nigeria
Original price was: ₦1,000.00.₦300.00Current price is: ₦300.00.
Rights in Community Land and Fundamental Land Concepts in Nigeria
Original price was: ₦1,000.00.₦300.00Current price is: ₦300.00.
Customary Land Control and the Origins of Nigeria's Land Use Act
Original price was: ₦1,000.00.₦300.00Current price is: ₦300.00.
Land Ownership Principles and Transaction Laws in Nigeria
Original price was: ₦1,000.00.₦300.00Current price is: ₦300.00.
Copyright warnings! Do not copy.
![A quantity of hot water at 100ºC is added to 400g of water at 10ºC until the temperature of the mixture is 60ºC. Calculate the mass of the hot water added. [Specific heat capacity of water =4200JKg-1 K-1]](https://erudites.ng/wp-content/plugins/contextual-related-posts/default.png "A quantity of hot water at 100ºC is added to 400g of water at 10ºC until the temperature of the mixture is 60ºC. Calculate the mass of the hot water added. [Specific heat capacity of water =4200JKg-1 K-1]")
