
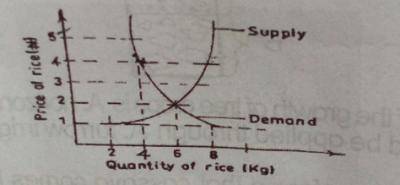
Study the graph illustrated below and answer this question correctly
A. shows an increase in the supply of rice
B. describes a shift in the demand for rice
C. describes the equilibrium price for rice
D. shows that the demand for rice exceeds supply
Correct Answer:
Option C = describes the equilibrium price for rice